In a digital world, analytics act as a single source of truth for your website. Analytics is the measurement and analysis of data collected by your website, which can then be used to generate insights about who is visiting your website and what actions they are taking once they are there. Oftentimes, they act as a way for organizations to benchmark performance and set targets for future goals.
At a high level, user data is collected via cookies. Cookies are files created by websites which store your browsing information the first time you visit, and which help analytics platforms recognize you as a familiar face the next time you visit. Cookies are commonly used for analytics platforms’ data collection process, however this may change in the near future. We’ll discuss the evolution of analytics platforms below.
Why are analytics important for your website?
visitors, what your most popular content is, and the journey they take on your website, among other actions. By providing you with quantitative feedback about how your website is doing, analytics can help you make data-driven decisions. Some analytics platforms even come with recommendations on what actions you can take to increase common success metrics such as purchases, time on website, and number of users.
If you are running a campaign or want to see how well a new change on your website is performing, analytics will also allow you to conduct actions like measuring effectiveness for campaigns, identifying your most popular content categories, and measuring changes from simple on-page SEO improvements. Please note that you will need to use custom URLs which utilize UTM parameters as part of your campaign for best results.
You might enjoy: The fundamentals of technical SEO
How to set up your website for Google Analytics
We like using Google Analytics for our clients. It’s free, easy to set up, and lets you collaborate with other users in your organization easily. More recent versions of Google Analytics are even utilizing AI to show you customized reports based on what is most relevant to your goals.
The basic steps of setting up your website on Google Analytics are:
-
1
Setting up your account and property. A property is a website or an app that you want to collect data for.
-
2
Setting up a reporting view. A view lets you create filtered versions of your data. Google Analytics will default to showing all website data, however you can choose to have a view of only certain types of data. For instance, you can choose a view that shows only US traffic. Some of our recommended views include:
- Main view: The primary view for analysis, where data is cleaned and filtered as needed;
- Raw data view: A view without any changes, which is useful for troubleshooting any issues with your data; and
- Test view: A view for testing new filters or changes to data before applying them to the main view.
-
3
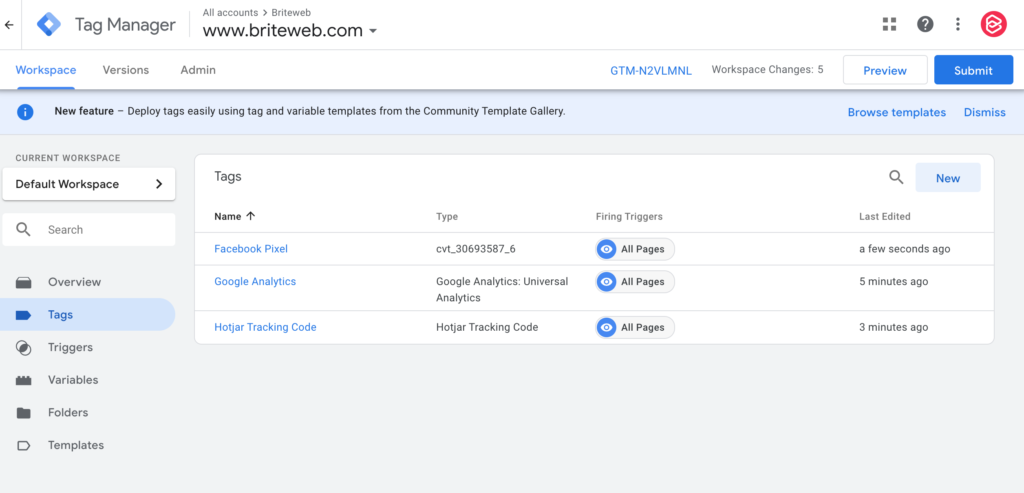
Adding tracking codes to your website. You can choose to use site tags or Google Tag Manager (GTM) to link your website to Google Analytics. With site tags, you will need to manually add tracking codes to website pages you want to track. GTM can manage various tracking tags in one place, making it easy for you to adjust and add tracking code to your website. GTM supports both Google and non-Google products, including Facebook Pixel, Hotjar Tracking Code, Crazyegg Tracking Code, and most other tracking codes of your choosing. Using GTM may also help your website load more quickly as tracking codes are loaded asynchronously from the rest of the web page, meaning that neither tags nor content will have to wait for the other to load.
You might enjoy: Google Tag Manager vs Google Analytics for Nonprofits

Google Tag Manager allows you to easily manage multiple tracking codes.
Once you have gone through the basic set up and have familiarized yourself with the reporting components such as audience, behaviour, and acquisition reports, it’s time to set up goals to track when a user takes a desired action on your website. Our tip is to be picky with your goals, and to constrain yourself to measuring only actions which you would consider a win. Consider the purpose of your site and the key behaviours that you’re trying to promote when you’re coming up with these.
Universal Analytics (UA) vs Google Analytics 4 (GA4)
The latest version of Google Analytics, known as GA4, tracks users through events. In contrast, older versions used Universal Analytics (UA) which tracked users through sessions. GA4 tracks unique users across devices instead of using cookies by using machine learning to recognize users based on available information. This means that if Jonny visited your website on both his laptop and his mobile phone, UA would count that as two unique users. However, GA4 would count those visits as one unique user. It is also important to note that GA4 now uses the term “conversion events” for goals. In GA4, you can simply flag certain events as conversion events, instead of formally setting up a separate goal.
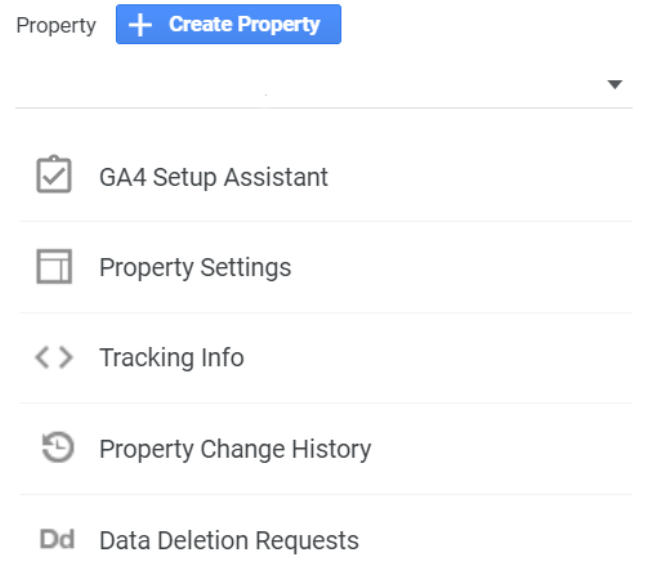
By default, all new Google Analytics accounts will be set up as GA4. If you have an existing Google Analytics account on UA, you can migrate your account to GA by going to ‘Admin’, and selecting ‘GA4 Setup Assistant’ under

‘Property’. If you are a brand new Google Analytics user starting out on GA4, please note that reporting views (Step 2 of how to set up your website on Google Analytics) no longer exist. There are just data streams for either apps or websites, and the only filters you can apply to it are to filter out internal or developer traffic.
What are the most important goals to track website performance?
It can be easy to get caught up in the ever-popular metrics of pageviews, number of visitors, and bounce rates, however the trick to focusing your efforts is to hone in on the metrics which matter to your organization. A question to ask here is: Are your users doing the thing you want them to do? For instance, a website focused on collecting donations may prioritize the dollar amount of donations over the bounce rate of the page. Once you have identified the actions you want a user to take, you can set up goals within Google Analytics.
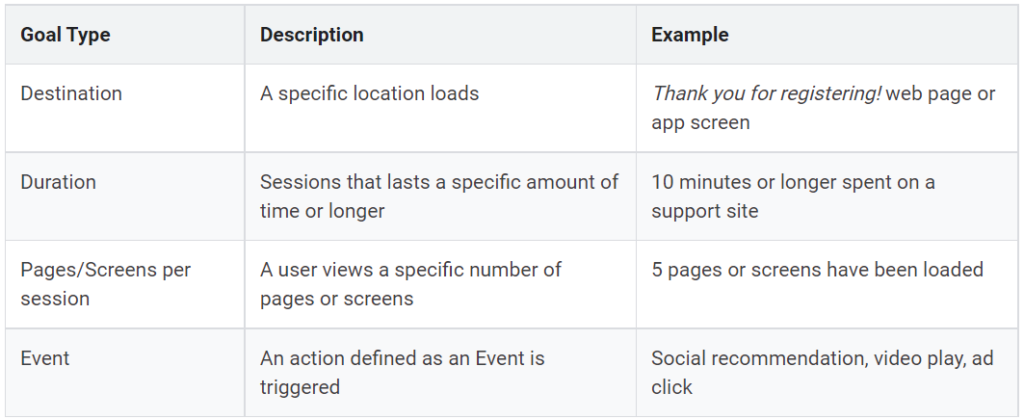
A goal is what it sounds like: it is a target behaviour that you want a user to reach. You can define these and, if desired, set up a monetary value to quantify how much each goal is worth to your organization. There are four types of goals in UA, listed below:

Source: Google
Now that we know what our goals are, here are some of our favourite ones to look at:
-
1
Goal value. If you have assigned a value to your goals or are using the Enhanced Ecommerce feature, goal values will help you keep tabs on how much revenue your site is generating.
-
2
Goal conversion rate. This tells you how often users complete specific goals that you are tracking, for instance making a donation or signing up for a newsletter.
-
3
Events. Website events show you what elements of your website are most engaging, such as the number of people who clicked play on a video on your site or downloaded a whitepaper.
-
4
Completing a call to action (CTA) or conversion. We especially like this for organizations with a form on their website, such as a donation form or contact form. This shows you how many people are interested in your cause.
-
5
Product impressions and purchases. While you may not be selling a product, your organization can repurpose Google Analytics’ Enhanced Ecommerce feature for other reasons, particularly tracking donations. Please note that if someone provides a donation, Google Analytics can only track the monetary value of it if the contribution happens on your website, and not a third-party site. For example, Google Analytics cannot track the value of a donation made through an embedded Stripe form. However, you can integrate Stripe with Google Analytics by using a tool like Zapier.
If you use GA4, you can use enhanced measurement to automatically set up some of these tracking codes, including scroll depth, outbound link clicks, site search, video engagement, and file downloads.
The final thing to keep in mind is that while you should keep an eye on what your competitors are doing, you don’t have to match their results exactly. Rather, you should compare your results to your existing benchmarks to understand what is working for you and what isn’t. If it’s working—congratulations! If it’s not working, analytics will serve as a guide to inform your next steps.
Need more help with analytics? Give us a shout! We’d love to hear from you.
